Don't take our word for it. Open the files.
Three complete case studies, each with the actual files to download and run yourself. Every number is reproducible: same file, same seed, same result — on your machine, in your browser, with nothing uploaded anywhere.
Tower C — Substation & Civils
The flagship walkthrough: a substation and civils package with a groundworks-heavy front end, long-lead switchgear, and a commissioning tail. The plan says 24 Aug 2027. The simulation says that date is a 2% shot.
- Import & gate. The demo network enters through the Fitness Gate at READY (100/100) — closed logic, no hard constraints, no leads — so the P-values that follow stand on solid ground.
- Register. Five discrete risks with owners: ground conditions (40%, PERT 15/30/60d, mapped across the earthworks chain), a fragnet-mode utility consent delay, switchgear delivery, commissioning defects, and one opportunity (early possession). Each carries a cost impact and a priced mitigation.
- Ranges & correlation. Three-point ranges on every activity, plus a ρ=0.8 correlation group across the groundworks crew — because the same crew running late on one dig runs late on the next.
- Run. Latin Hypercube, seed 8812. P50 lands 10 Nov 2027, P80 3 Jan 2028 — 94 working days of exposure beyond the deterministic date, led by switchgear delivery and the ground-conditions risk.
- Cost. The QCRA layer carries £5.60m of base cost to £6.13m at P80, with the joint confidence "football" showing how often date and cost commitments hold together.
- Mitigation. Same-seed pre/post comparison: the £135k mitigation package buys the P80 back by 47 working days — ≈£2.9k per day saved. That chart is the business case for the risk budget.
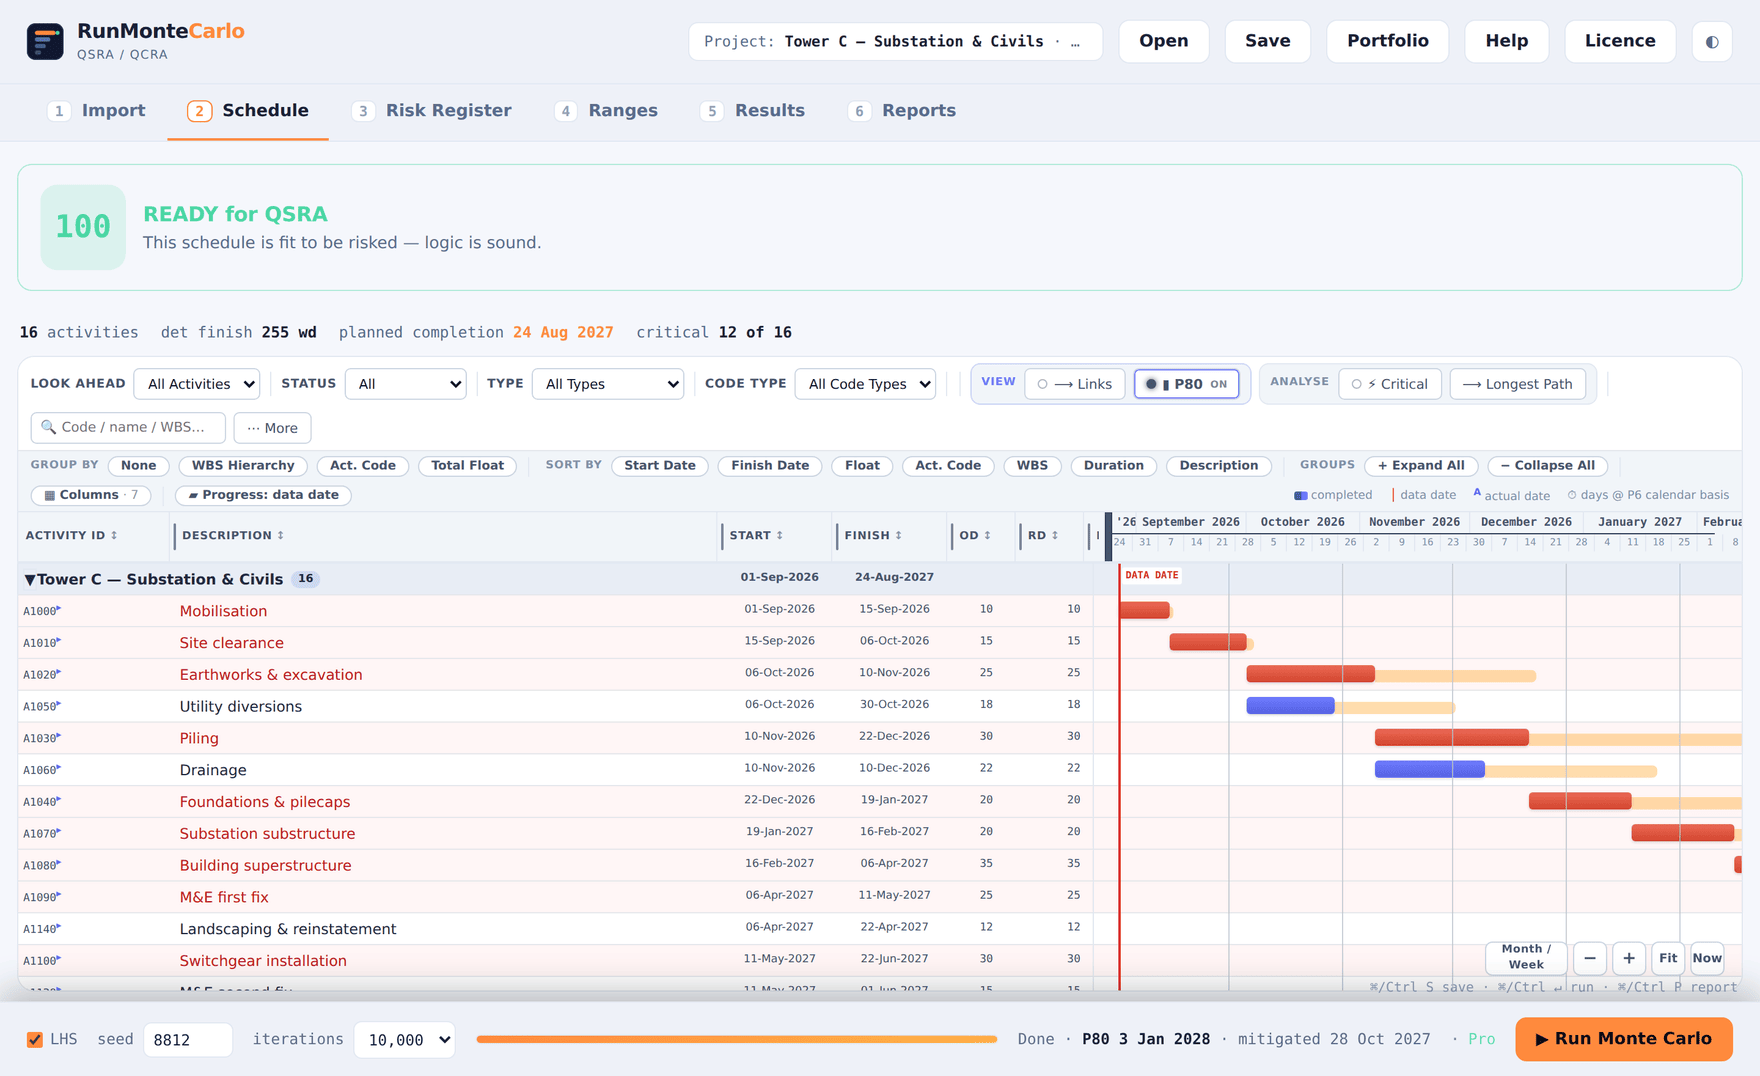
Open the app → Open → pick the .riskproj → press Run with seed 8812. You'll reproduce every number above.
Open the app and try it →SUBSTATION-B — re-link on schedule update
QSRA isn't a one-off — it's a monthly rhythm. The month-two problem is always the same: the planner issues a new XER, and your carefully-built register and ranges point at last month's schedule. RunMonteCarlo's answer is re-link: drop the new file onto the existing Risk File.
- Month one. Import substation-b-v1.xer — a deliberately imperfect network. The DCMA 14-point gate catches what's wrong before you simulate: 33% missing logic, a lead, a hard constraint, 88% FS. Verdict: NOT RECOMMENDED — with each finding listed. (Risk it anyway if you choose; the gate is advisory and the caveats print in the report.)
- Build the risk model against v1: ranges, a risk on the steelwork, costs.
- Month two. Import substation-b-v2.xer — one activity deleted, one added, one duration changed. The re-link banner reports exactly what moved: activities matched (by ID, then code), ranges & costs carried over, risks kept, dead mappings flagged, new activities given default ranges.
- Re-run. Minutes, not a rebuild. That cycle time is the difference between QSRA as a living control and QSRA as an annual ritual.
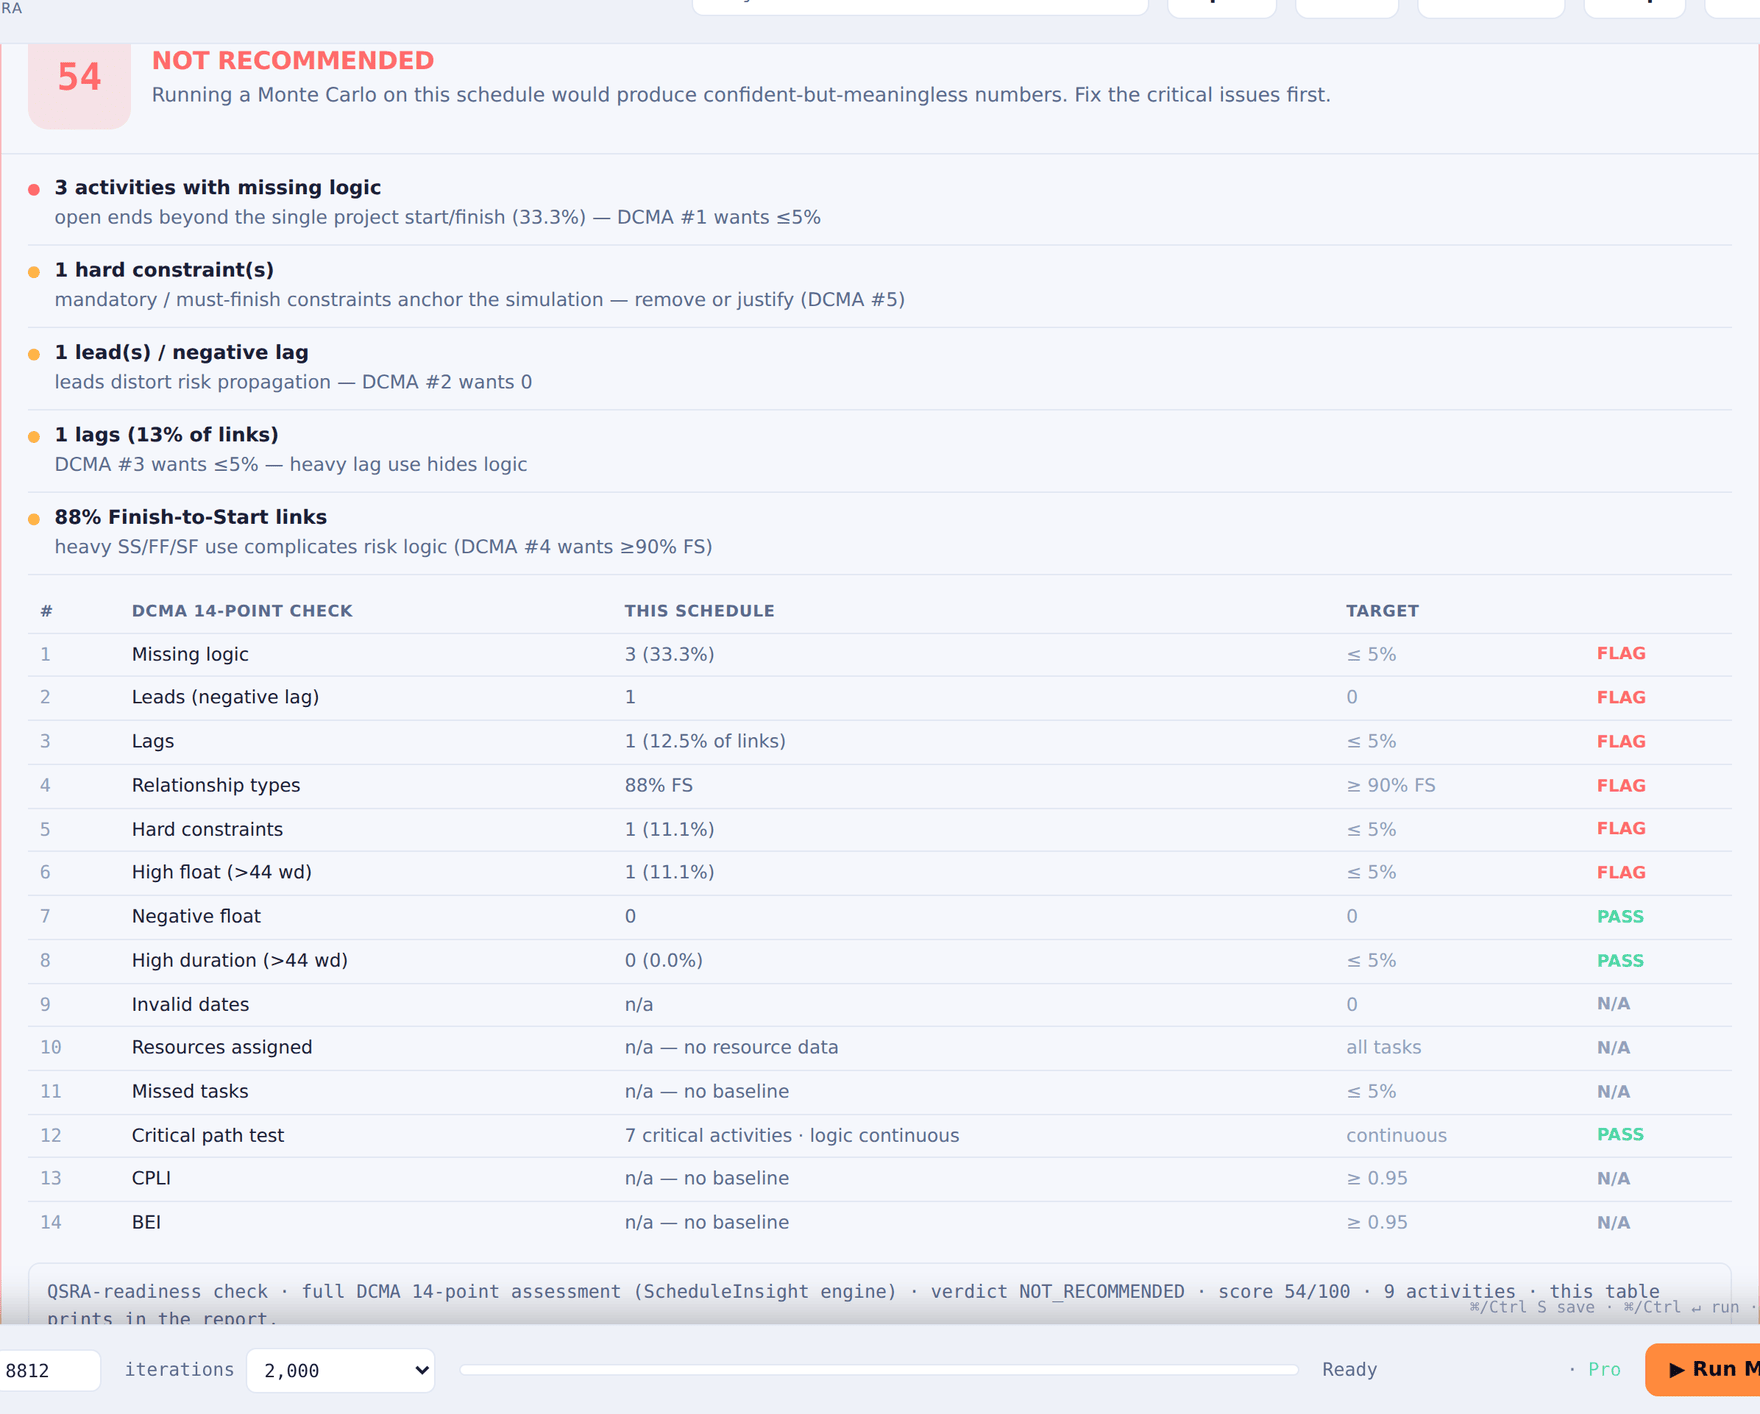
Import v1, add a risk or two, then import v2 over the top and watch the re-link banner do the month-two work.
Open the app and try it →Validation V1 — prove the engine against a closed-form answer
The strongest check on any simulation engine is a network whose answer is known exactly. V1 is two independent parallel paths — U(80,120) and U(70,130) working days, both planned at 100 — so the finish is max(A,B) and every quantile has a closed form.
| Statistic | Analytic | RunMonteCarlo | Difference |
|---|---|---|---|
| P50 | 110.000 | 110.075 | +0.075 d |
| P80 | 119.102 | 119.090 | −0.012 d |
| P(achieve day 100) | 25.0% | 24.9% | −0.1 pt |
It's also the cleanest demonstration of merge bias — the reason deterministic dates are optimistic: each path individually is 50/50 to hit day 100, but the project is only 25%, and its P50 is day 110. Ten days of slippage from geometry alone, before a single risk is added.
The full derivation, formulas and references are on The Maths → Validation. This check runs in our automated test suite on every engine change.
Open the app and reproduce it →