See the actual tool
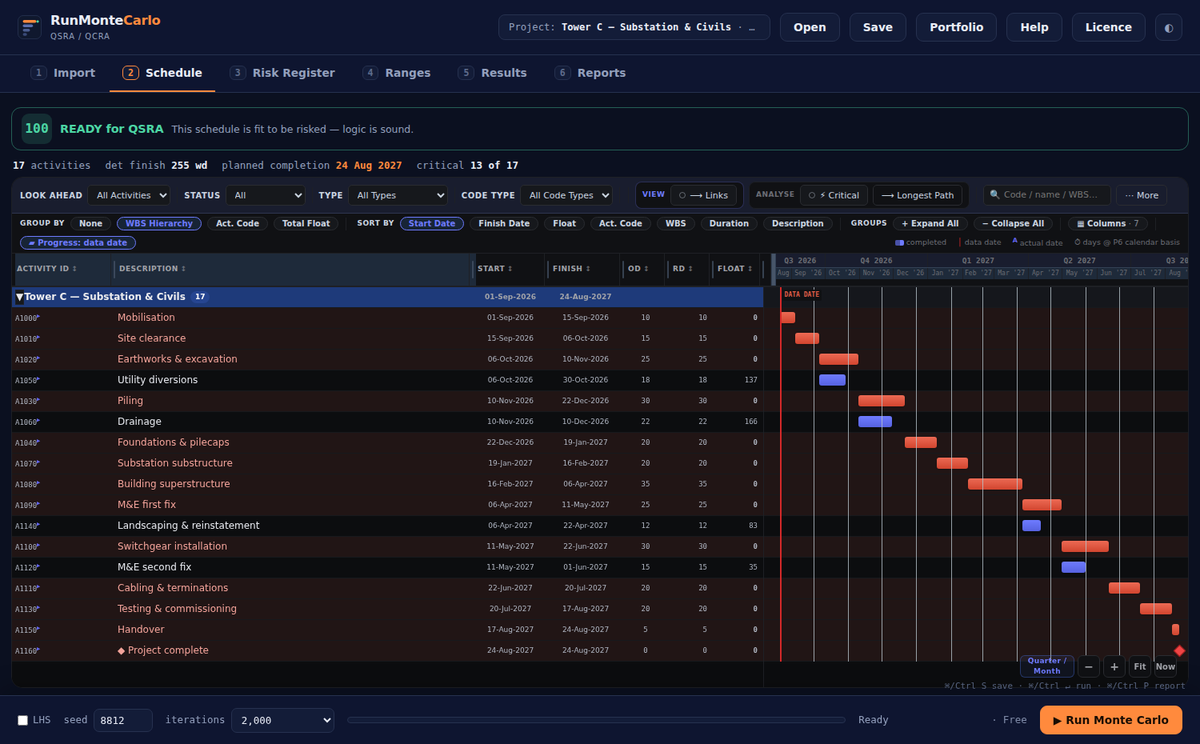
Not a mock-up — the real interface, on a real schedule. Grade it, simulate it, hand over the report.
For planners & risk analysts on Primavera P6 and MS Project.
Turn a single-point date into a defensible P80 — with the tornado, the cost, and a submission-ready QSRA report — entirely in your browser. Nothing uploaded, ever.
Pertmaster's last major update was 2013. Its successors need a Windows desktop, an enterprise quote, and an IT department. Meanwhile your frameworks still mandate quantitative risk analysis every period — and your register still lives in Excel.
Schedule and risk register are parsed and simulated entirely on your device. We physically cannot see them — not policy, physics. Your Risk File saves to your drive, not our database.
Every simulation records its seed, settings, and input hashes — printed in the report. Anyone can re-run your analysis and get identical results. Try asking a desktop tool for that.
Email each owner a self-contained review copy — it opens in their browser as its own editor, no install, no login. Changes merge back with a who-changed-what history.
Everything a QSRA/QCRA needs, nothing an enterprise sales cycle wants.
Drag in a P6 XER/XML or MS Project XML. Full CPM network, calendars and logic — parsed client-side in seconds.
Paste your existing Excel register, map risks to activities, set 3-point estimates by rule (triangular, PERT, uniform).
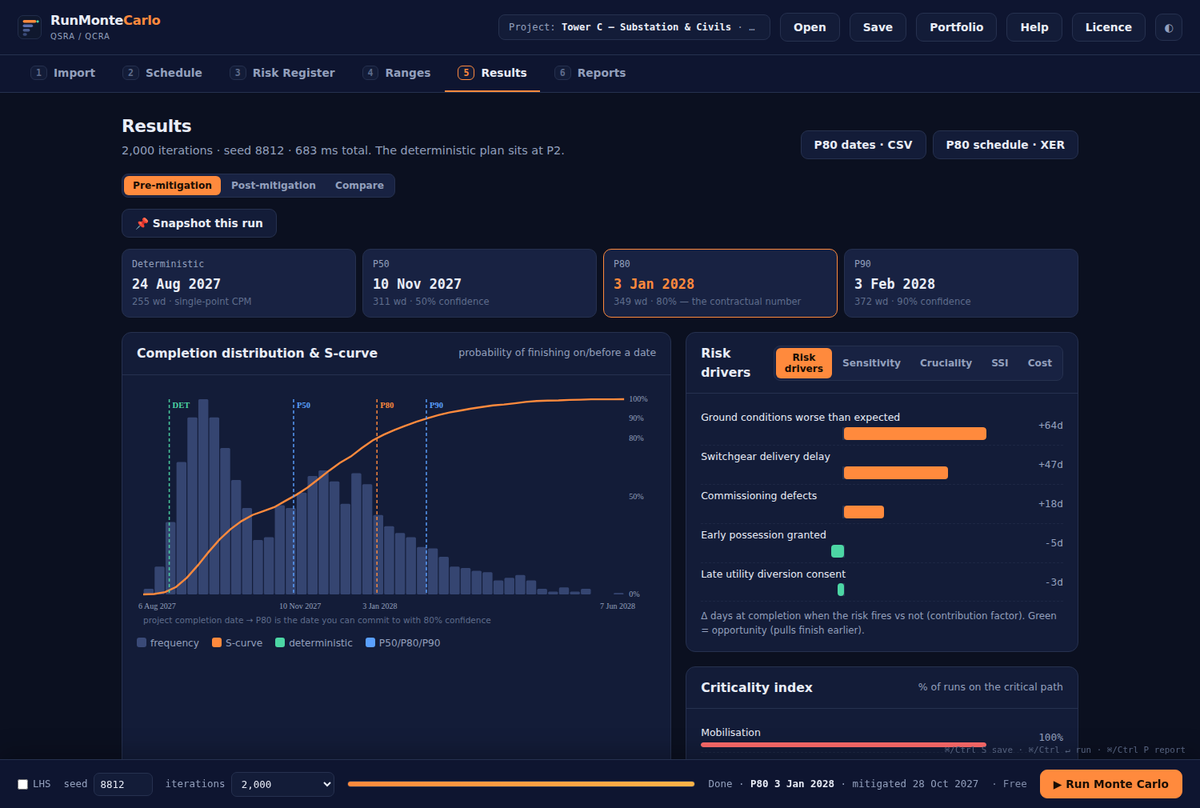
Seeded Monte Carlo with live convergence. Pre- and post-mitigation scenarios side by side.
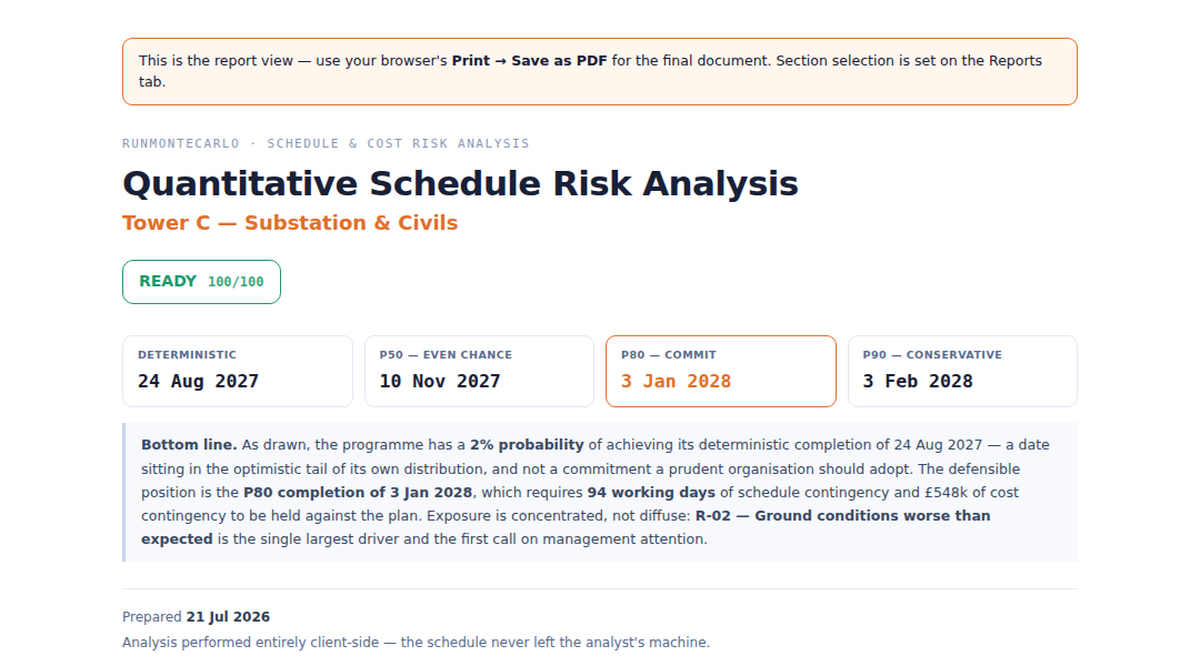
S-curves, P-value tables, tornado & criticality charts, and a branded, method-stated QSRA pack — PDF, one click.
Not a mock-up — the real interface, on a real schedule. Grade it, simulate it, hand over the report.
Every incumbent is quote-only. We think you should know the price before the demo — because there is no demo, just the tool.
Full details, feature matrix and FAQ on the pricing page →