How to · guide 01 of 12 · 8 min read
A typical run — import to report
The whole method is the tab order. One pass through the six tabs takes a schedule from "the plan says 24 Aug" to a defensible P80 with the drivers ranked and a print-grade report — this is the cycle every other guide hangs off.
- Import the schedule. On 1 Import, drop a Primavera P6 .xer or PMXML, an MS Project .xml, or a plain CSV/TSV task list (ID, Name, Duration, Predecessors — the download CSV template link shows the exact shape; Asta users export a task list to CSV). The Fitness Gate then grades the file against the full DCMA 14-point check and prints READY for QSRA, READY WITH CAVEATS or NOT RECOMMENDED with every finding listed. The gate is advisory — you can always run — but its verdict prints in the report, so fix what you can at source.
- Read the schedule. The app lands on 2 Schedule: a read-only Gantt with WBS grouping, ⟶ Links, ⚡ Critical and ⟶ Longest Path overlays, look-ahead and code filters, and a detail panel on double-click. This tab is for verifying you risked the schedule the planner actually issued — durations and logic are never edited here, only re-imported.
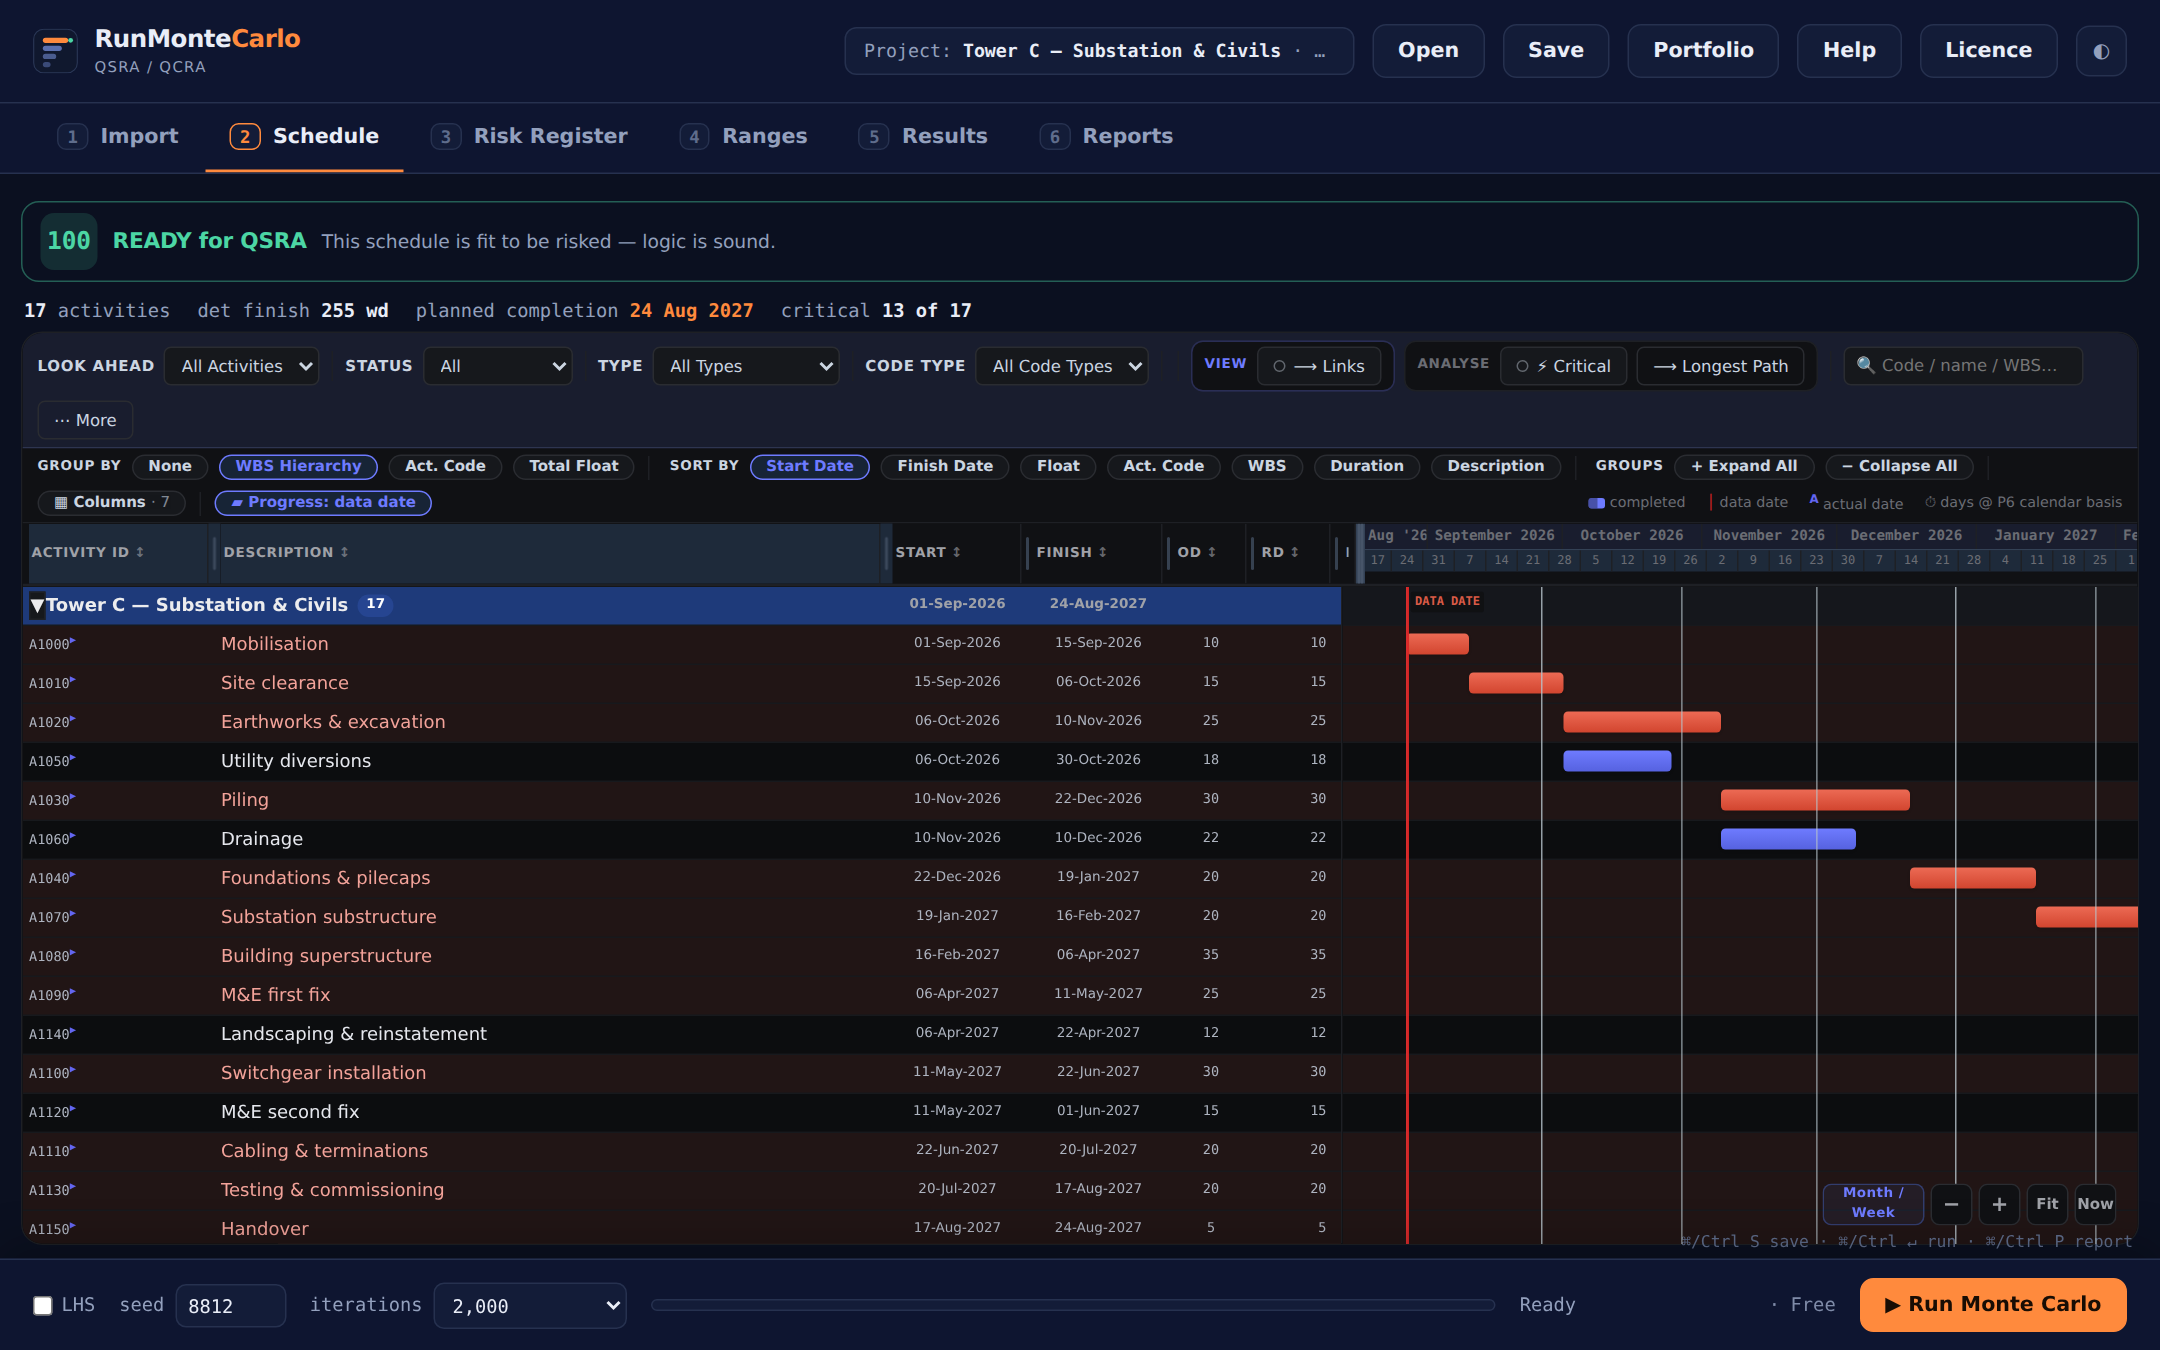 The demo passes the gate at 100/100; critical activities read amber down the register-style listing.
 - Build the Risk Register. On 3 Risk Register, click + Add risk per discrete event: name, Owner, type (threat / opp), probability (0–1), an impact distribution (triangular, pert, trigen, uniform, normal, lognormal, discrete) with min / likely / max in working days, an optional Cost £ impact, and the activities it Maps to. Already have a register in Excel? Copy puts the table on the clipboard, pasting a tab-separated block bulk-adds by ID, and CSV ▾ exports a blank template or imports a populated one. ✨ Suggest mappings proposes register→activity links by text similarity — deterministic and explainable, no AI.
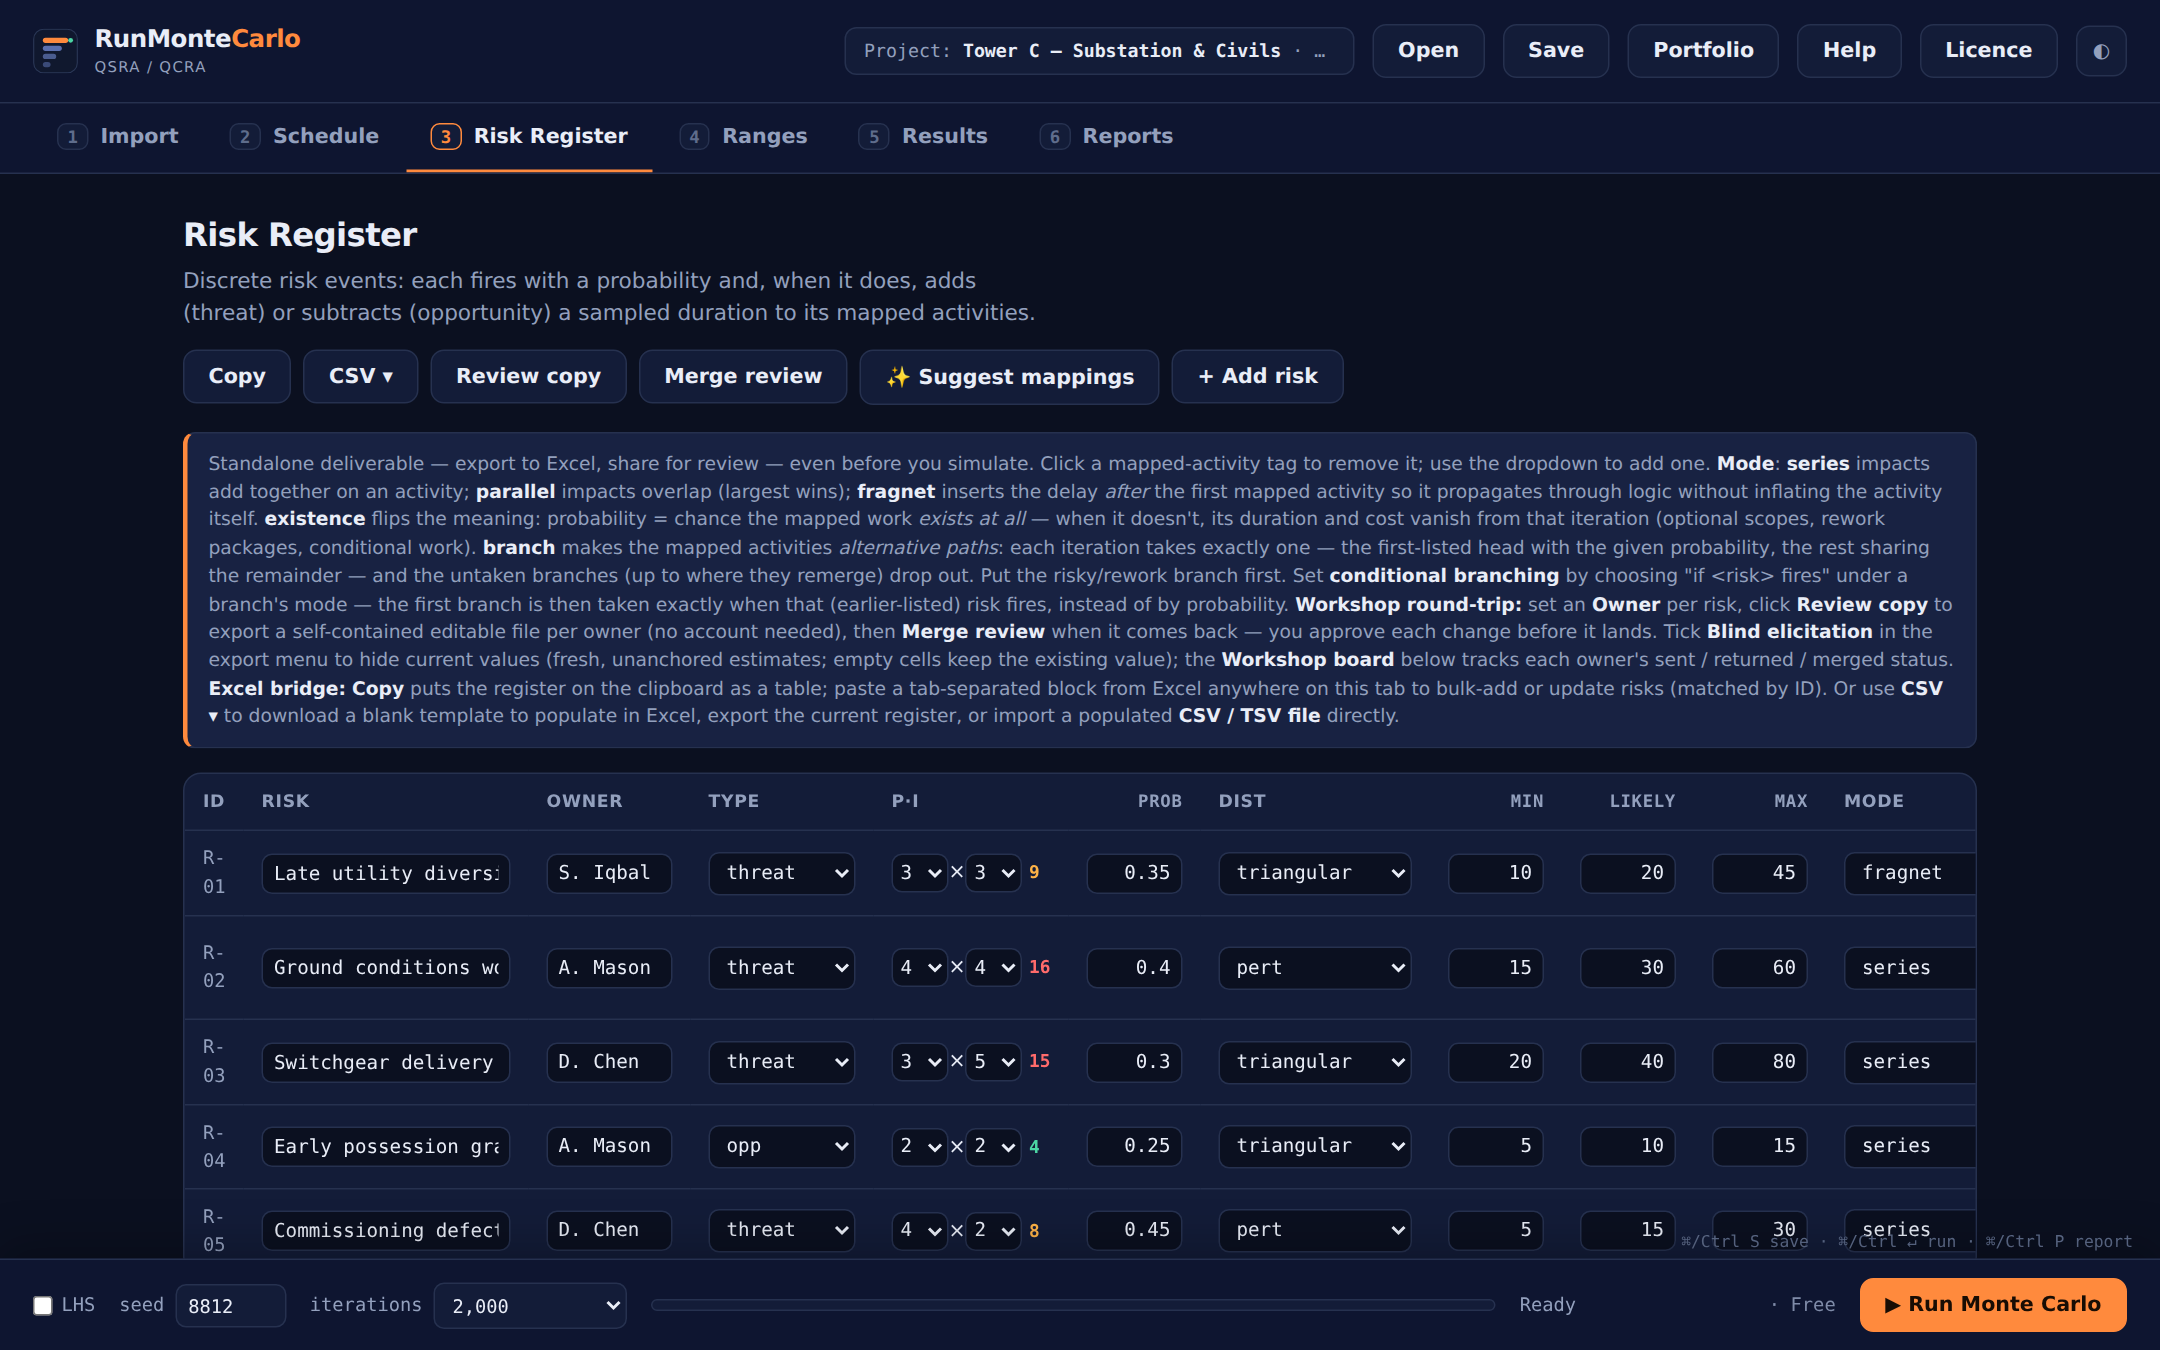 The demo register: five risks with owners, P·I screening scores, quantified impacts — note the Mode column, where fragnets and branches live (guides 04–06).
 - Set the Ranges. On 4 Ranges, pick a calibration preset — Conservative (−5/0/+10%), Typical (−10/0/+25%) or Aggressive (−15/+5/+40%) — then override any activity's three-point band or distribution in the table. (Yes, "Conservative" is the narrowest band — it's conservative about the estimate, not the outcome.) Per-group overrides let different WBS branches carry different uncertainty; the cost columns (Cost £k, C.min / C.likely / C.max) feed the QCRA layer.
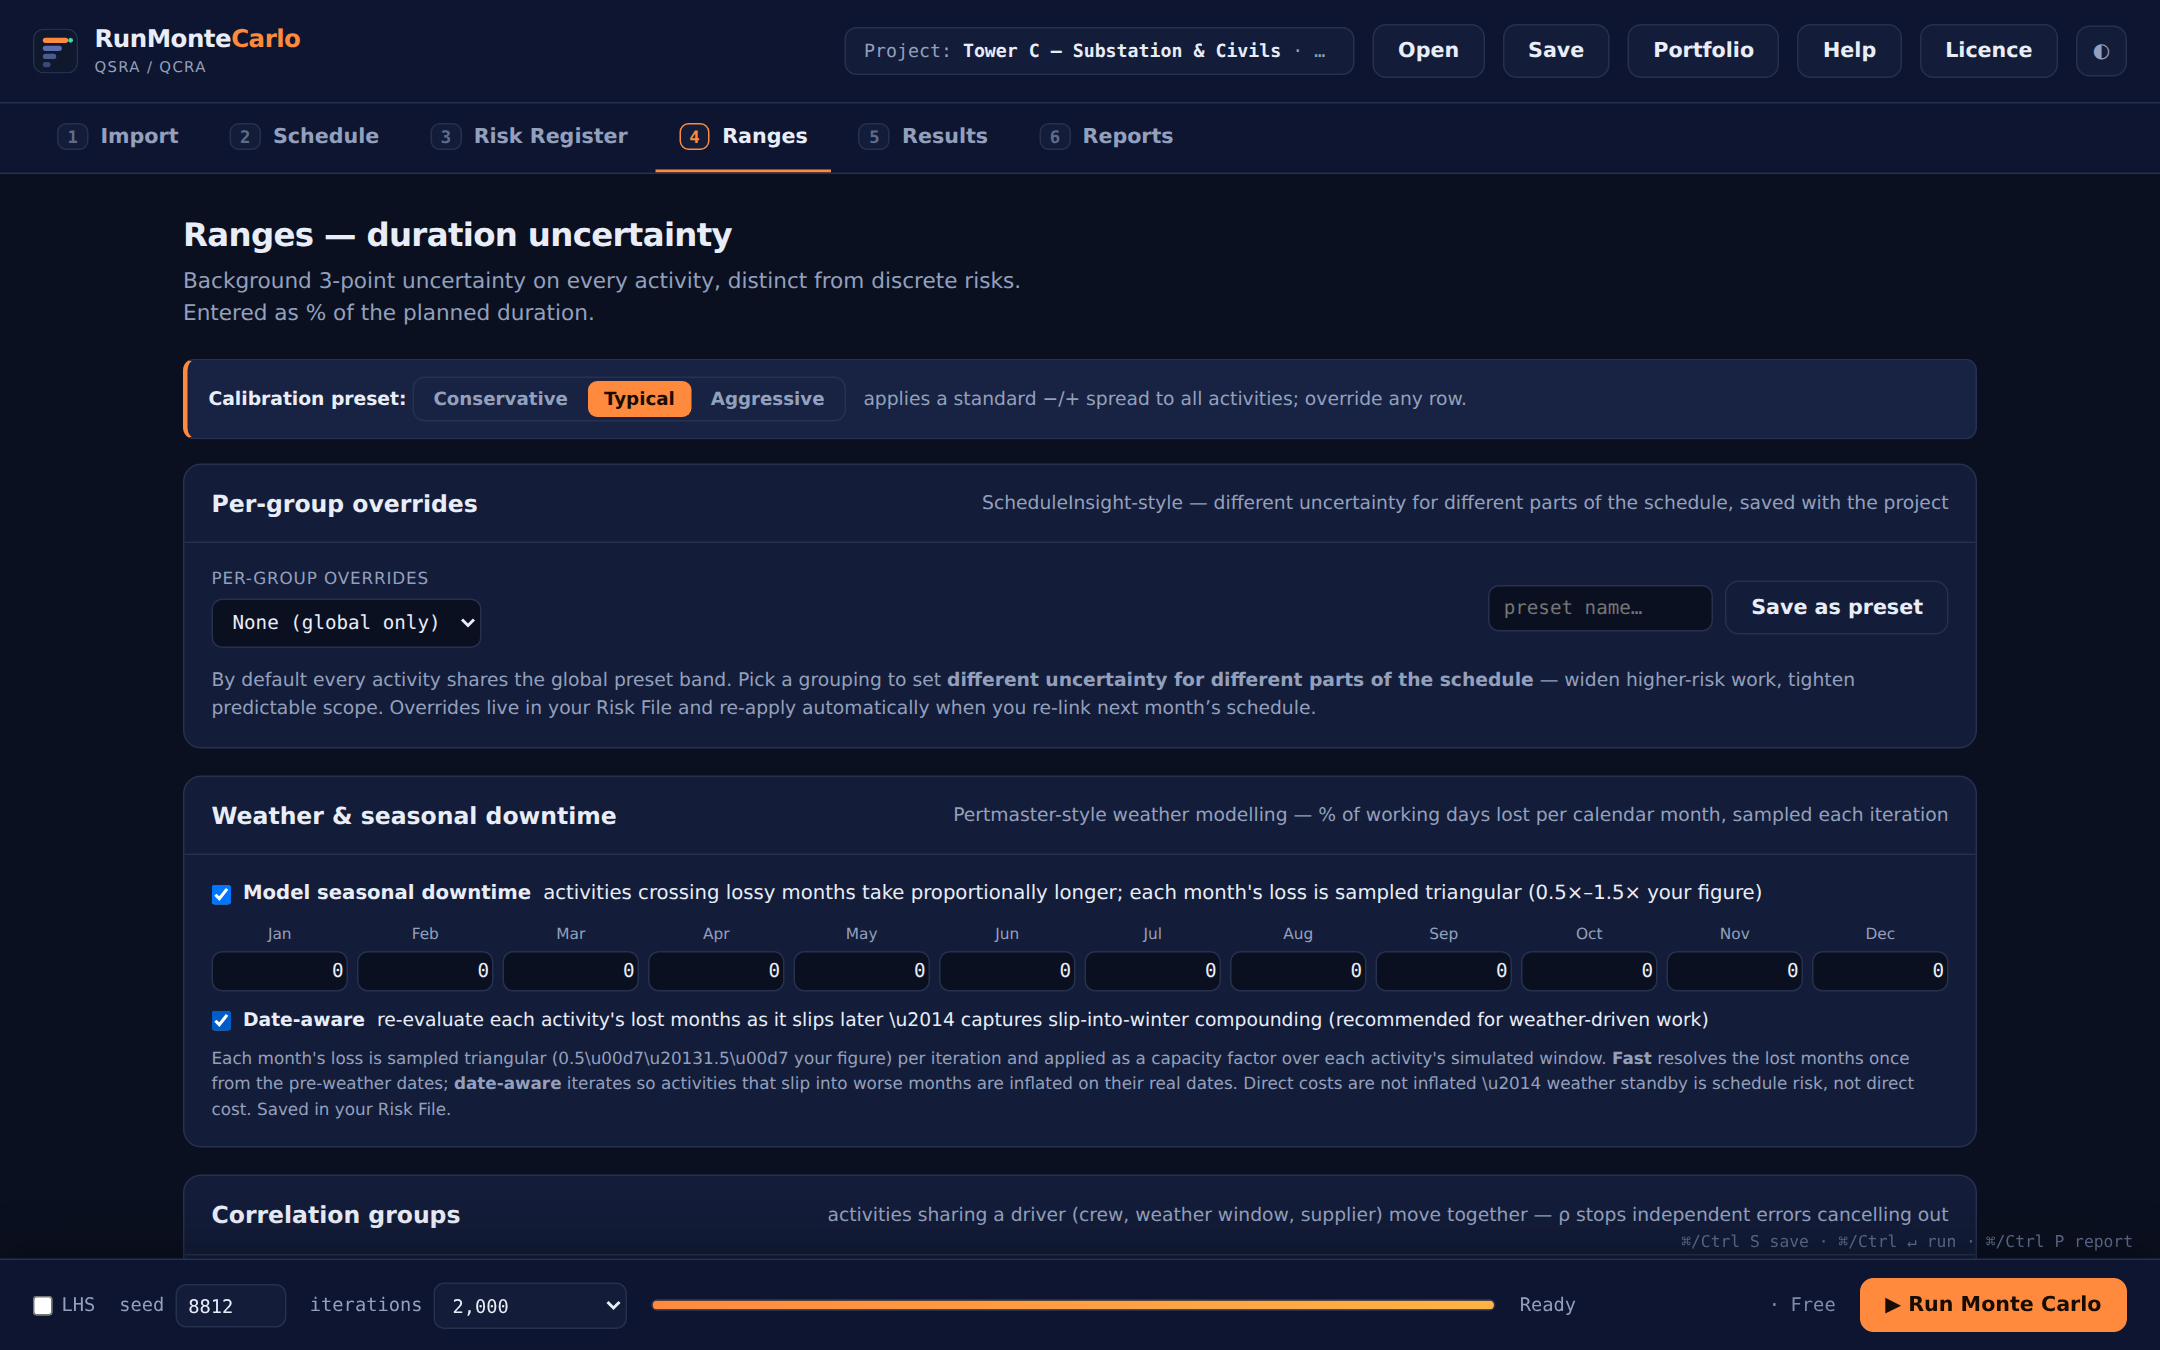 One preset applies a standard spread to everything; override where you know better. Weather and correlation (guides 07–08) live here too.
 - Run. Set the seed (write it down — it makes every number reproducible), pick iterations, optionally tick LHS for stratified sampling, and press ▶ Run Monte Carlo or ⌘/Ctrl ↵. Two thousand iterations on the demo takes under a second.
- Read the results. 5 Results opens on the four tiles — Deterministic, P50, P80 ("the contractual number"), P90 — above the completion distribution and S-curve. Below: the driver tornado (six views — Risk drivers, Sensitivity, Cruciality, SSI, Cost, Variance), the criticality index, measured risk paths, milestone confidence, cost risk with the JCL football chart, and probabilistic cash flow. 📌 Snapshot this run pins any run for side-by-side comparison; the footer prints a convergence check and a reproducibility certificate anyone can Verify.
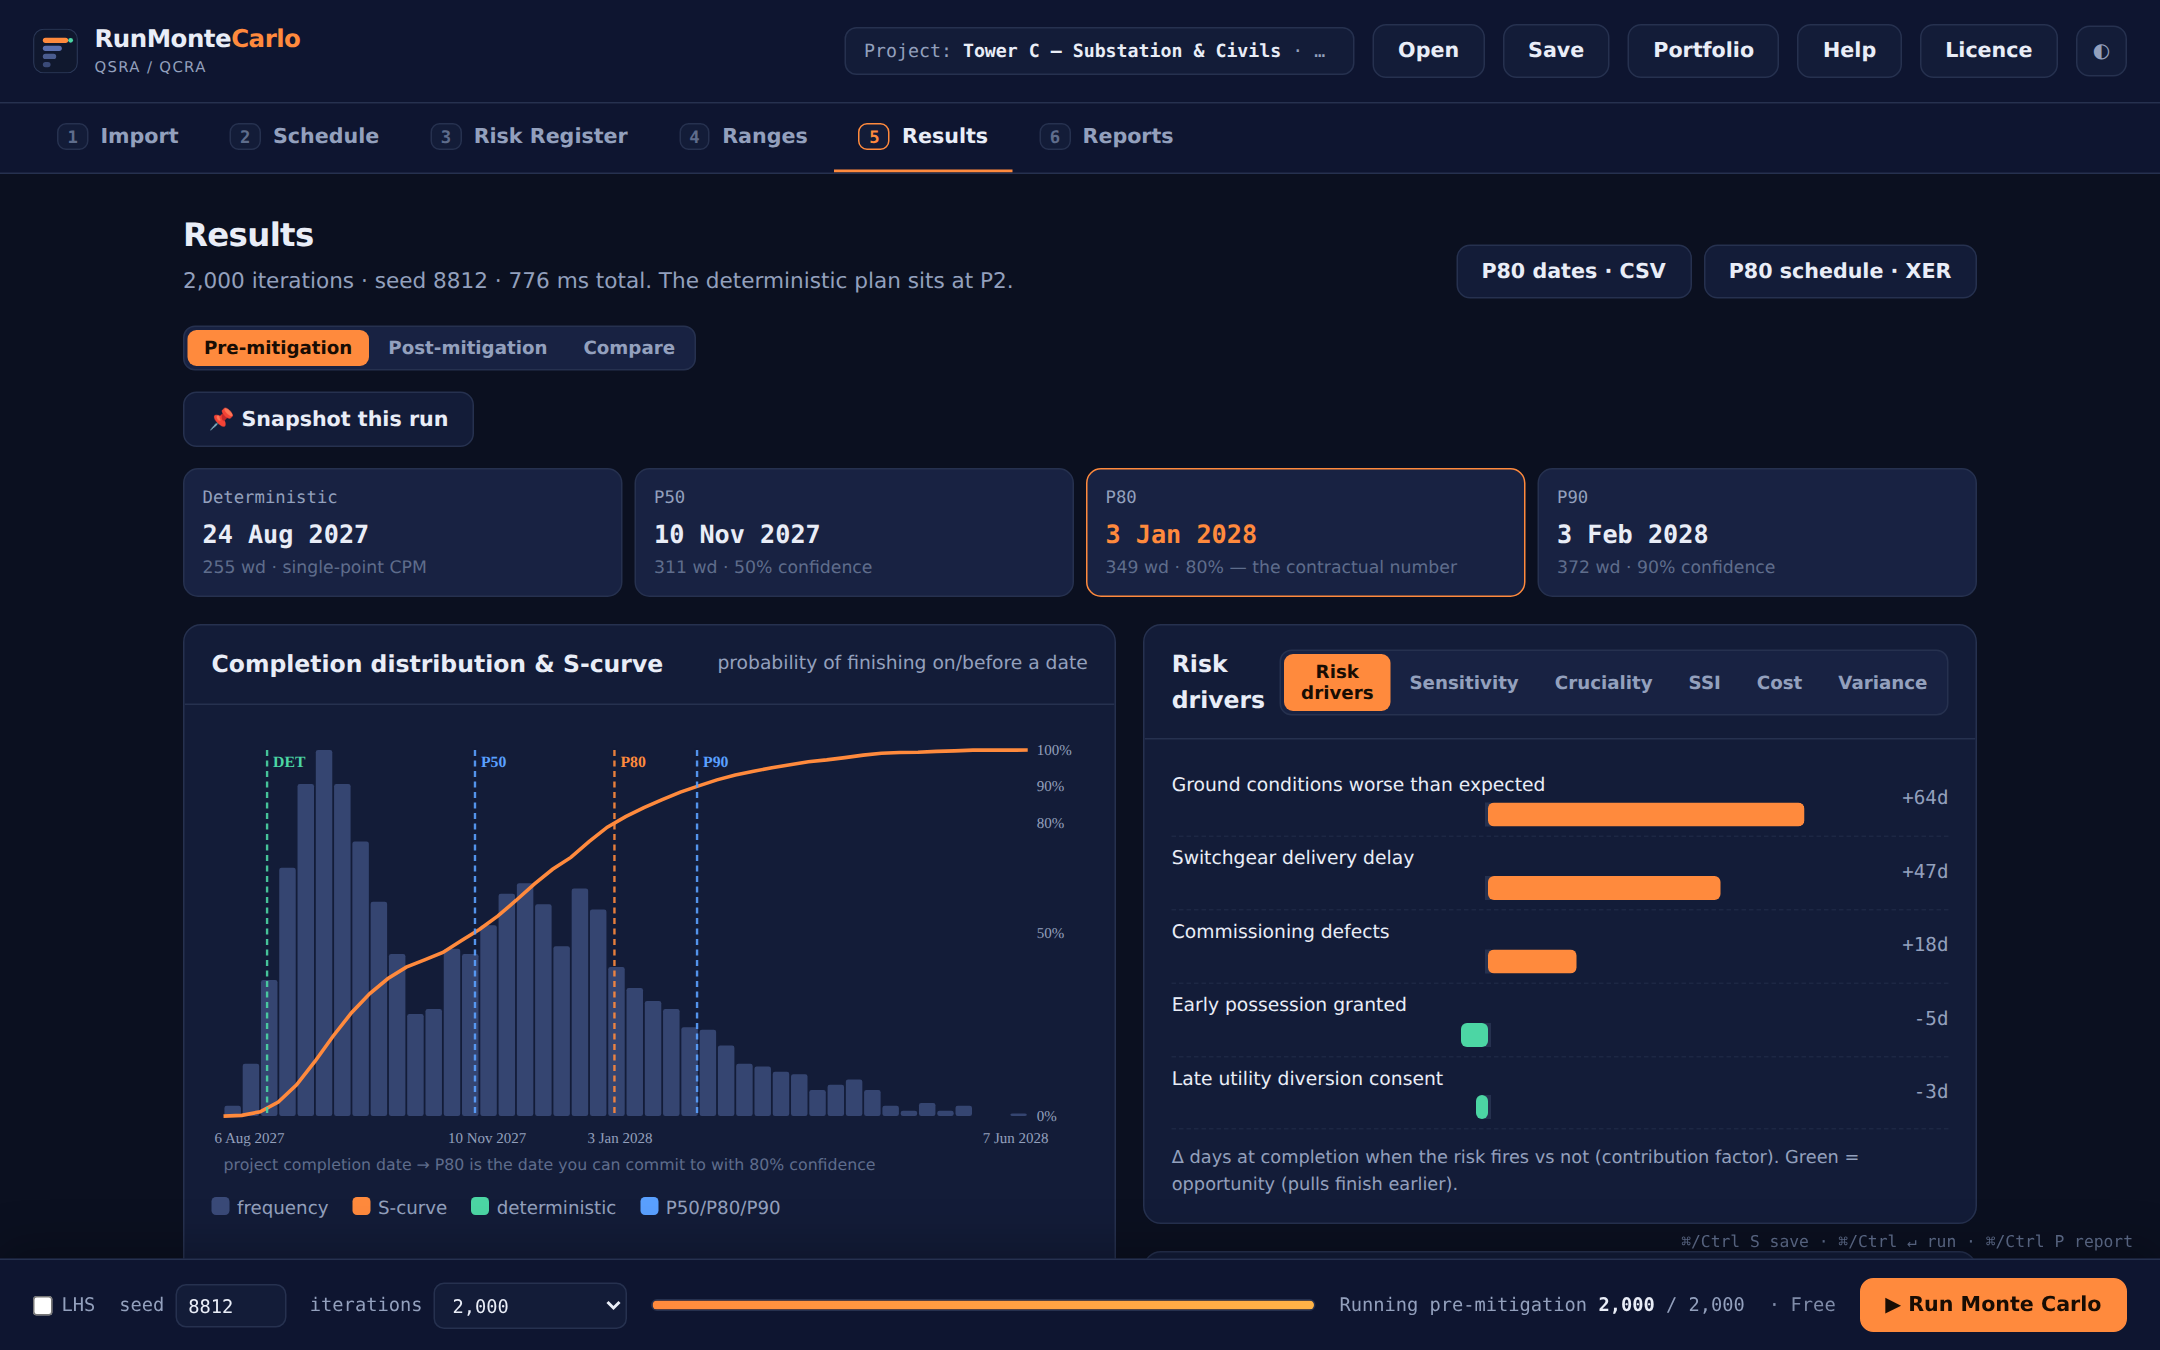 The plan said 24 Aug 2027. The simulation puts that at P2 — and names the two risks buying most of the 94-day gap.
 - Generate the report. 6 Reports offers five deliverables, each a Generate button: the full QSRA / QCRA pack, a one-page Executive Brief, the Risk Register report (no run needed), NEC programme risk (Time Risk Allowance framed for NEC4 ECC clause 31.2), and Mitigation & Contingency. Tick sections on or off in Report contents & options, set analyst / organisation / logo in Report settings, and print to PDF from the browser. Every page carries the seed and engine version, so every number is checkable.
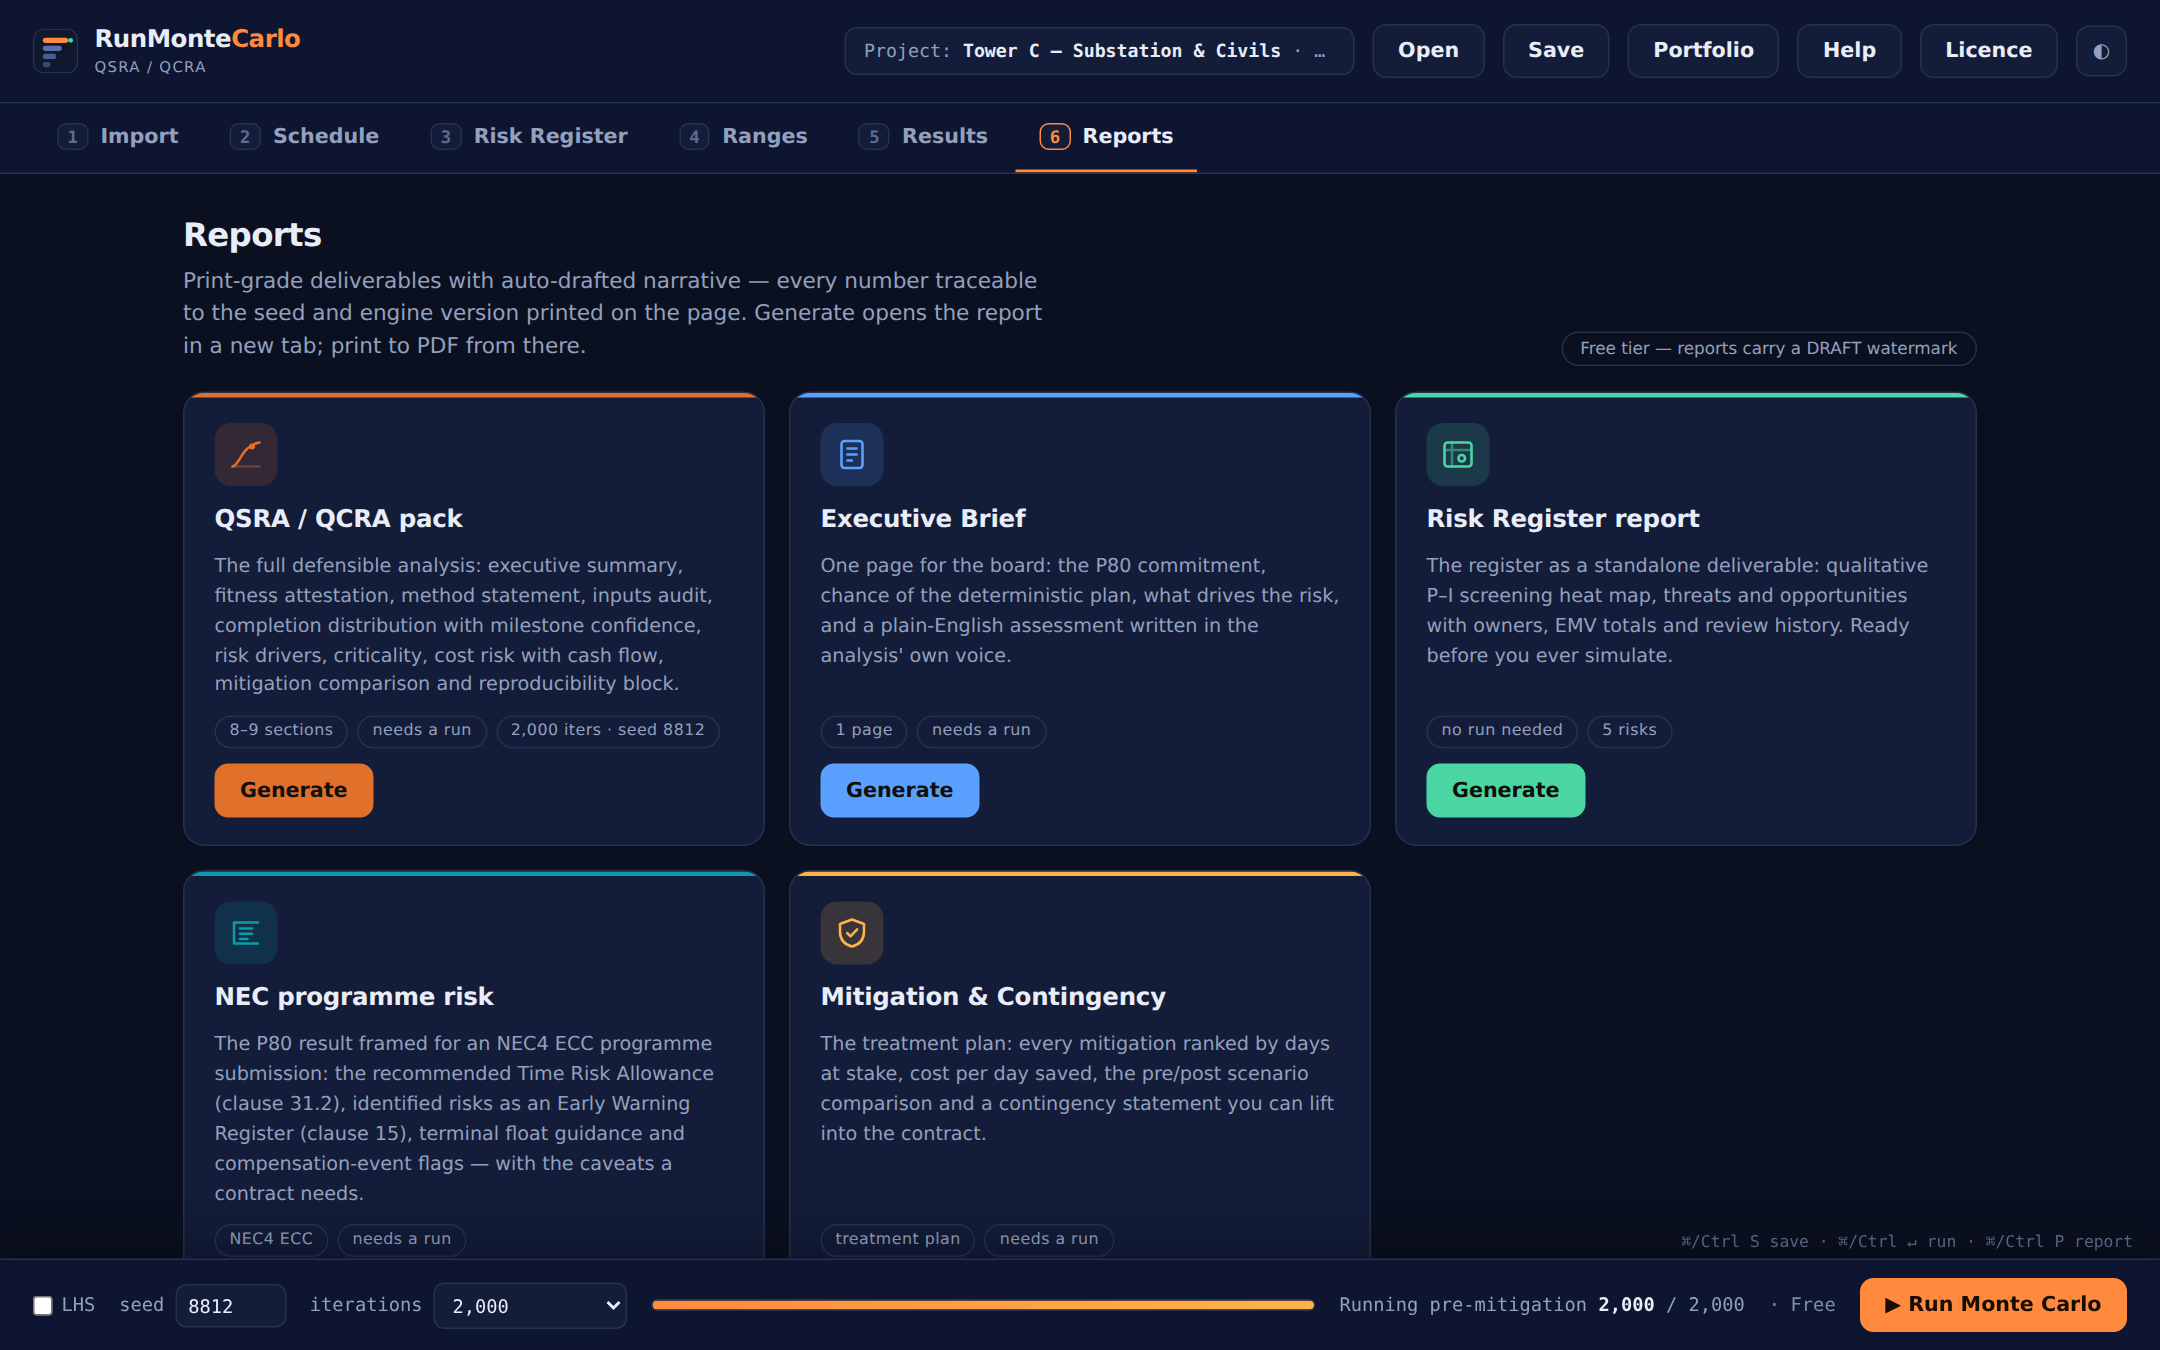 Five deliverables from one run. Free-tier reports carry a DRAFT watermark; the content is identical.
Mitigation is a first-class scenario. Fill the green Post-P / Post-Lik columns (and Mit £ for the cost of the action) and the run produces pre- and post-mitigation scenarios under the same seed — the Compare view then prices what the mitigation package buys in days and pounds. That chart is the business case for the risk budget.
Load the demo and run the cycle →